In our coverage of the 2007 World Figure Skating Championships we noted that the distribution of marks in the Ladies and Men’s Short Programs displayed an odd behavior, where the marks in the second half of the events were abruptly higher as a group than the first half. This unusual bimodal distribution was something we had never seen previously in figure skating marks. We attributed this odd behavior to a new method of seeding the Short Programs that was introduced for the 2007 ISU Championships and to limitations in the ability of the judges to mark consistently over long periods of time.
In this new seeding method, the higher ranked skaters perform in the second half of the event, and the lower ranked and unranked skaters perform in the first half of the event. Within the first half of the event the draw is random. For the second half of the event, the highest ranked skaters in the event perform in the last two warm-up groups, with the remainder in the first two warm-up groups. Within the last two warm-up groups the draw is random, and within the first two warm-up groups the draw is also random.
As an example of the new process, in the Ladies Short Program at 2007 Worlds there were 45 competitors. The first 22 ladies competed in the morning, with their start order determined by a random draw. After an interruption of many hours, the last 23 ladies competed in the evening, with the start order for the first 11 ladies determined by random draw, and then the start order for the last 12 skaters determined by a random draw.
Since Worlds we have looked at the marks under IJS in greater detail to determine how well the judges maintain continuity of judgment during a competition. Coaches have suspected for some time that marks under IJS tend to increase during an event. Some even have a name for this effect, calling it AZM, meaning "After Zamboni Marks."
After careful study of numerous event segments where there is a random draw, including domestic and international competitions from the Juvenile to Senior level, we find there is an unmistakable systematic upwards drift in the judges' marks that is present in nearly all event segments. This drift amounts to typically 4-8 points during events, even for events as small as 12 competitors. This drift has a clear impact on which skaters advance from initial rounds to final rounds, and which skaters receive medals.
In the following plots and tables we illustrate the presence of this effect, and discuss the impact it has on competition results.
[Note: By virtue of the competitions selected for study, the results in this paper apply to USFSA National judges and ISU judges. Lower level USFSA judges have not been included in this study.]
In a random draw, where the best skaters and worst skaters are randomly and evenly distributed in the start order, the marks should not show a trend up or down; that is, the average marks in each warm-up group should be the same. By the luck of the draw, however, the best skater might actually be in the later warm-up groups. In that case the marks should trend up during the event. If by the luck of the draw the best skaters are in the earlier warm-up groups, the marks should trend down. Over the course of many event segments, one should find events that trend up, events that trend down, and events with little or no trend. With many event segments, as many should trend up as trend down and the average of many event segments should show no trend at all if the draw is random and the judges are consistent in their marking standard.
It was widely said under 6.0 that placements drifted downwards (results improved) during an event, and thus there was a disadvantage in skating earlier in an event. In a study of 6.0 marks ten years ago, and again in 2004, we found that was not in fact the case. The analysis in 2004 made use of marks from the 2003 and 2004 U.S. National Championships for all event segments with random draws for Novice through Senior (30 event segments total). We make use of that data again here.
Under 6.0 one finds events where the placements trend up, others where they trend down, and still others which show little trend at all. Averaged over several event segments, placements in 6.0 do not show a statistically significant trend for earlier skaters to be placed better or worse than later skaters in unseeded event segments with a random draw. Thus, under 6.0, the judges had the demonstrated ability to mark events with a consistent standard that did not put skaters at an advantage or disadvantage due to start order.
The following four plots, taken from the 2003 U.S. National Championships illustrate placement trends under 6.0. Note that for 6.0 we analyze the placements, since under 6.0 the judges place the skaters and then decide on marks to support the placement.
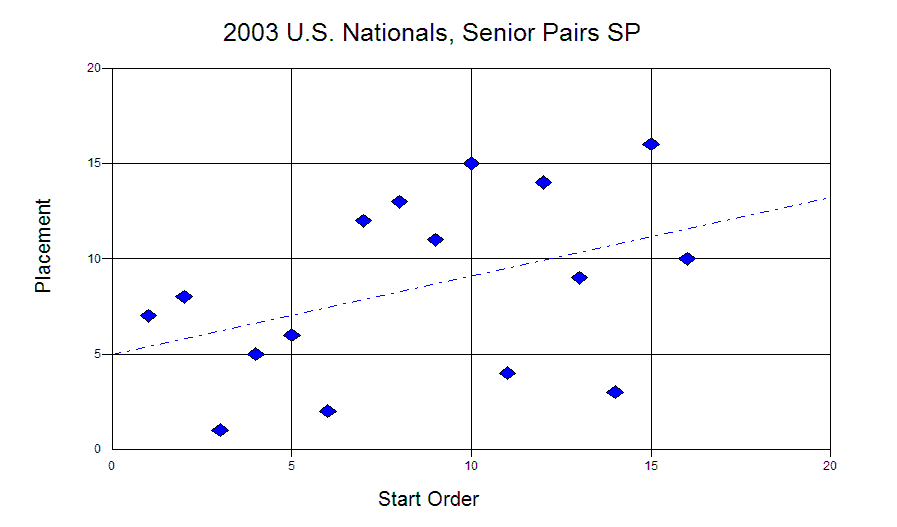
In the Senior Pairs Short Program, the placements trend up during the event.
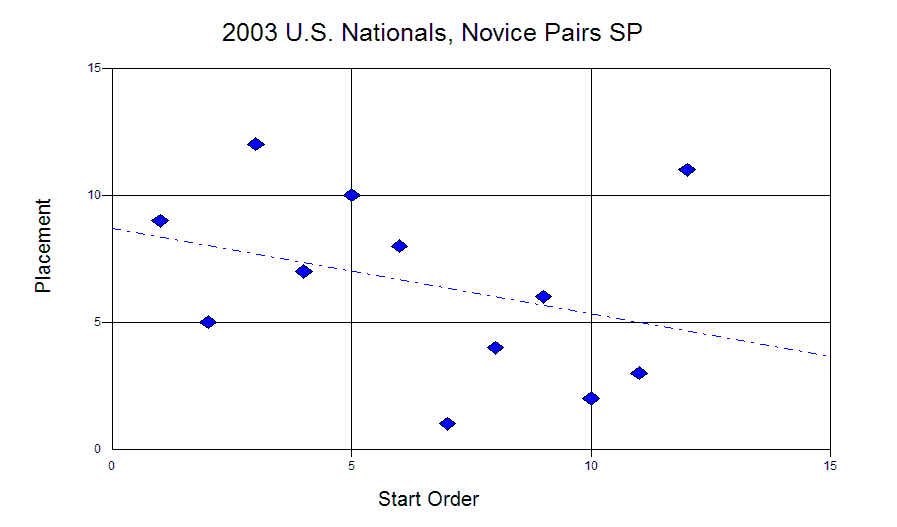
In the Novice Pairs Short Program, the placements trend down during the event.
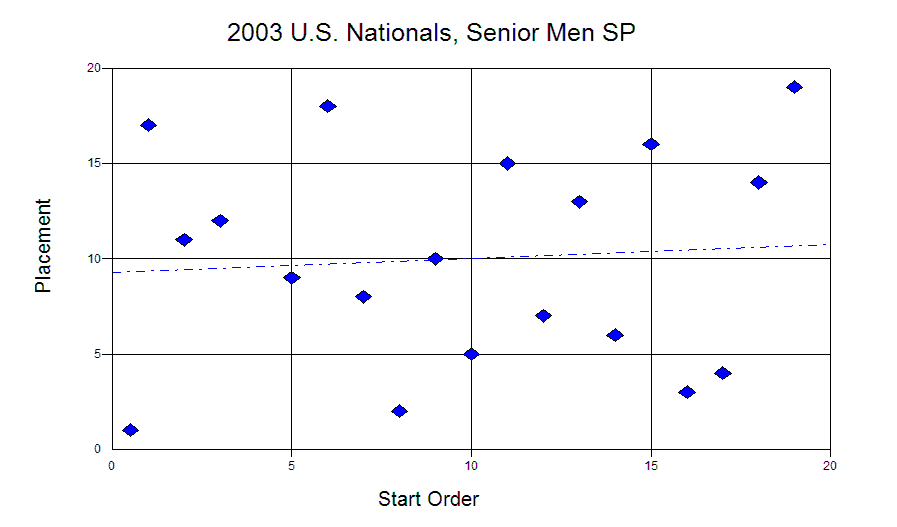
In the Senior Men's Short Program, the trend in placements is small, near zero.
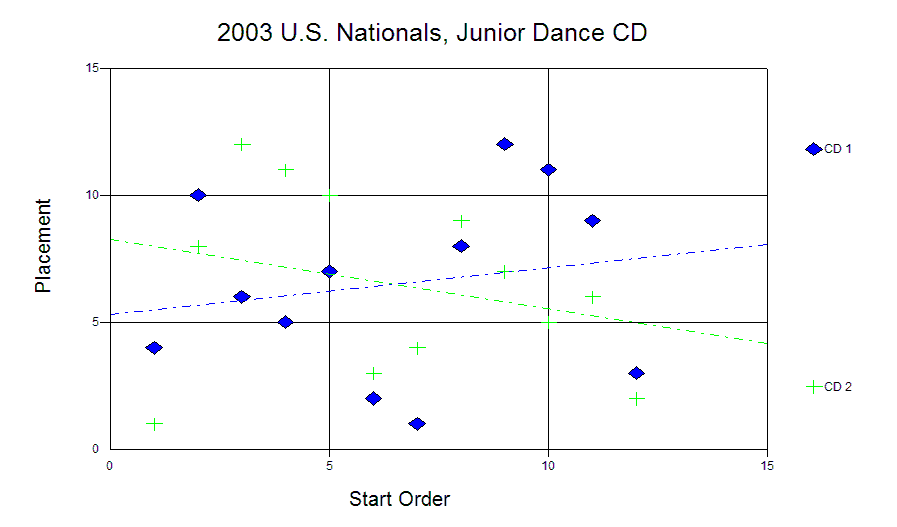
Trends for the two Junior Dance Compulsory Dances.
The previous plot shows the trends for two sequentially skated Compulsory Dances. The start order for the first dance is random. The start order for the second dance is taken from the first dance, starting in the middle of the start order of the first dance.
Note that one dance trends up, while the other trends down. By the luck of the draw, the best couples tended to skate in the first half of the event so the placements trend up. For the second dance those same couples performed in the second half and so the placements trend down. This behavior offers unambiguous proof the trends seen primarily reflect the ability of the skaters and not lack of consistency in the judging.
Collectively, the above plots demonstrate that judges were capable under 6.0 of marking in a consistent way throughout events which typically had a size of 12-24 skaters. This is not to extol the virtues of 6.0, but simply to demonstrate that consistent judgment can be achieve under the right circumstances. Later in this paper we will discuss how under IJS the Technical Panels, under the right circumstances, are also capable of consistent judgment throughout an event segment.
With the preceding background, the question now is how well do the judges maintain consistency in scoring under IJS. As far as we are concerned 6.0 is history, a disconnected phone number, an unsupported software package, an expired rebate, dead and buried. IJS is now. Fair competition now demands that the skaters have a level playing field with respect to start order. So we ask, does IJS deliver a level playing field? If not, why and what should be done about it. That is, how do we squeeze the best results possible out of IJS today.
The following graphs from various competitions illustrate the effect drift in the marking standard has during an event under IJS. These graphs represent but a sample of event segments studied in domestic and international competition, at the Juvenile through Senior levels.
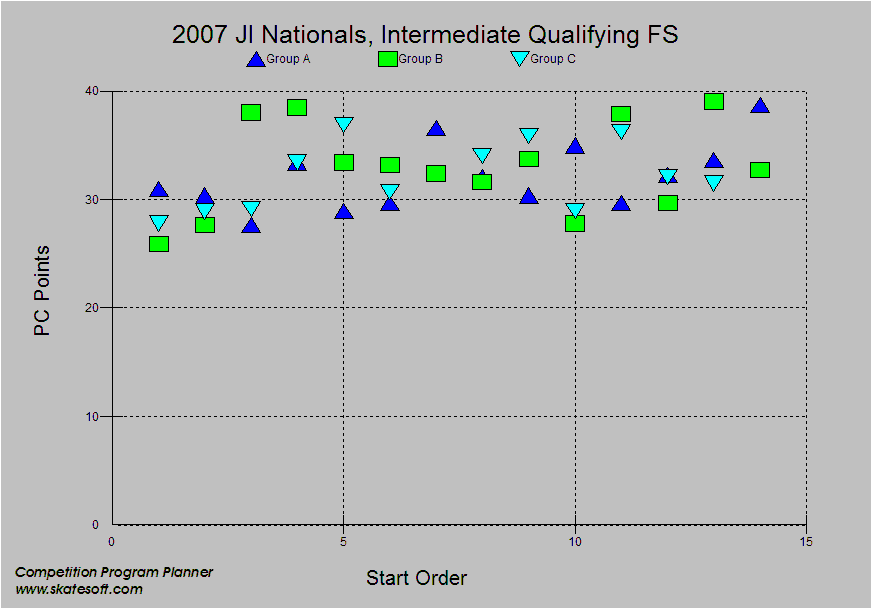
This example is for the three Intermediate Ladies qualifying rounds at the 2007 JI Nationals. For all three groups the total PC score drifts up by about 6 points on the average during the time to judge 13-14 skaters.
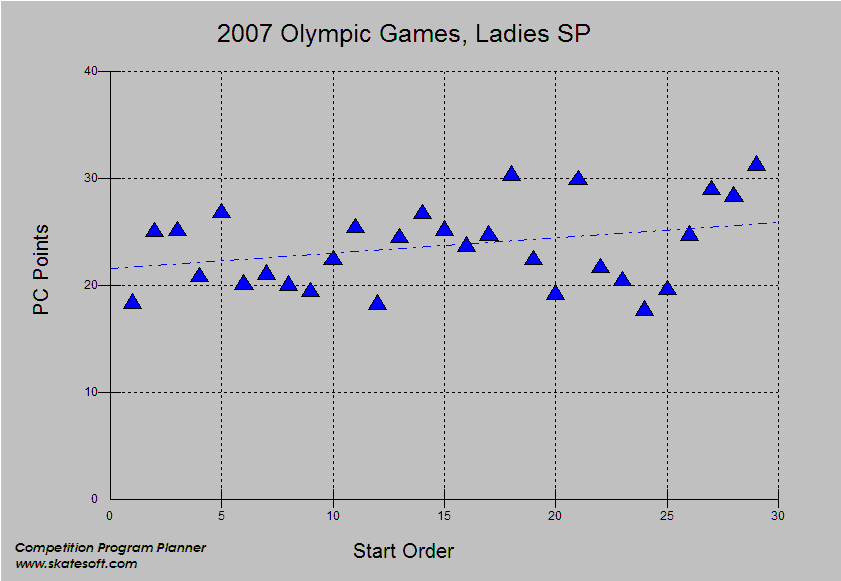
This example is for the Ladies Short Program at the 2006 Olympic Games. The trend is upwards by 5 points over the course of the event. Note also how the spread in the marks increases from left to right. Could this be an indication the judgment of the judges is not only drifting, but becoming more erratic during a lengthy event?
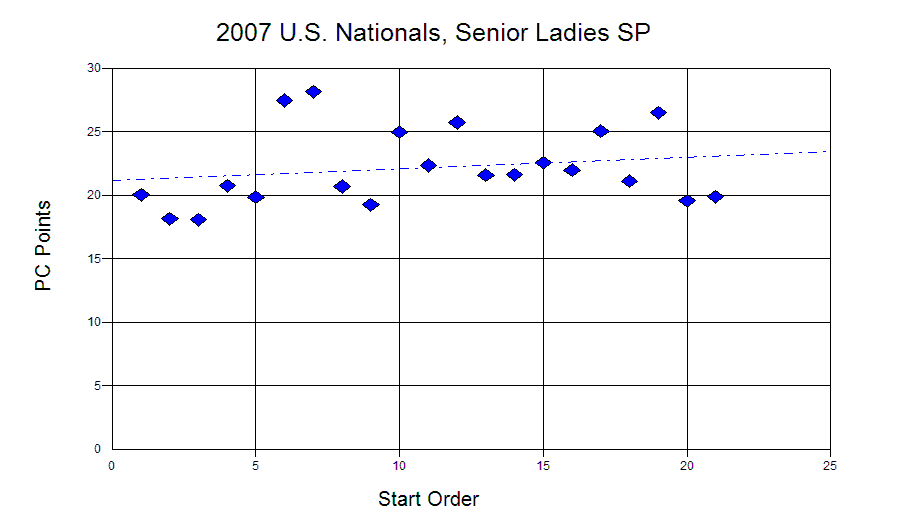
At the 2007 U.S. National Championships a drift of 3 points is calculated for 21 skaters in the Senior Ladies SP.
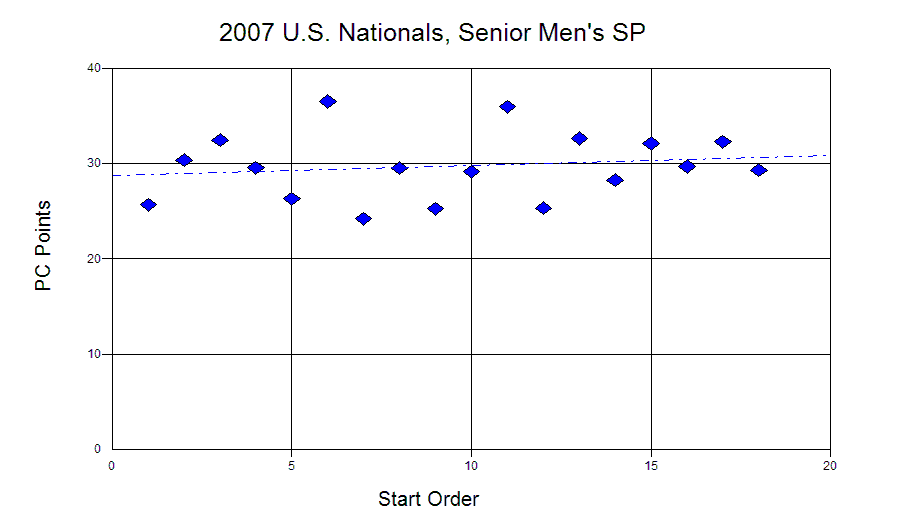
In the Senior Men’s SP a drift of 2 points is calculated.
Similar drifts as the above two examples are also measured in the Novice and Junior Short Programs (including Pairs) and in all the Compulsory Dances.
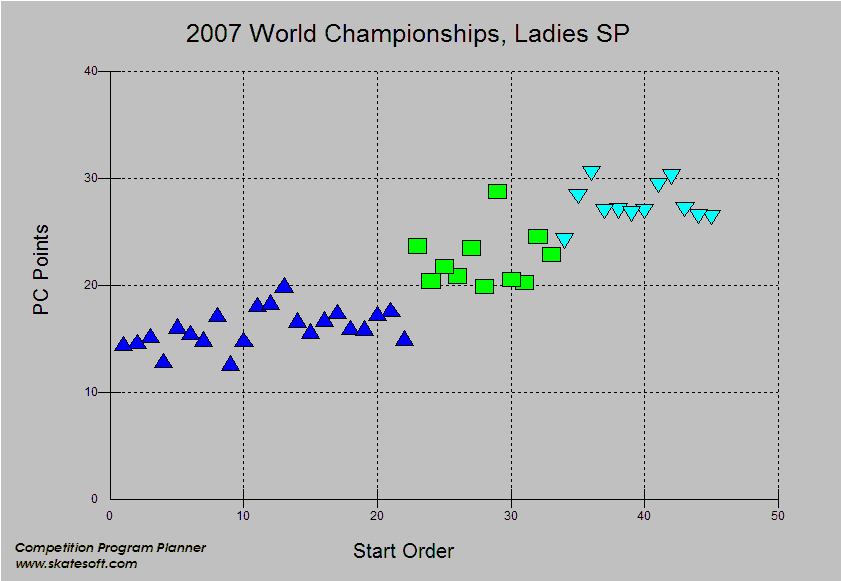
This example is for the 2007 World Figure Skating Championships Ladies Short Program. For this event segment the draw was only random within three seeded sub-groups of skaters. Each subgroup is shown in a different color. For the first 22 skaters, judged in the morning, there was a random draw. The trend is upwards by 3 points for those skaters. For the next 11 skaters, judged in the evening, there was a second random draw. The trend is upwards by 2 points. For the last 12 skaters, judged last in the evening, there was a third random draw. For the third group the trend is flat.
In addition to the upwards trend in the scores for the first 22 skaters, note also the clear discontinuity in the scores from the first half of the event in the morning to the second half in the evening. The jump from the blue skaters to the green skaters is five points. Neglecting skater 29, there also appears to be another discontinuity from the green skaters to the cyan skaters. Rather than having one competition of 45 skaters, this graph indicates the Ladies Short Program was marked like two different competitions to two different numerical standards.
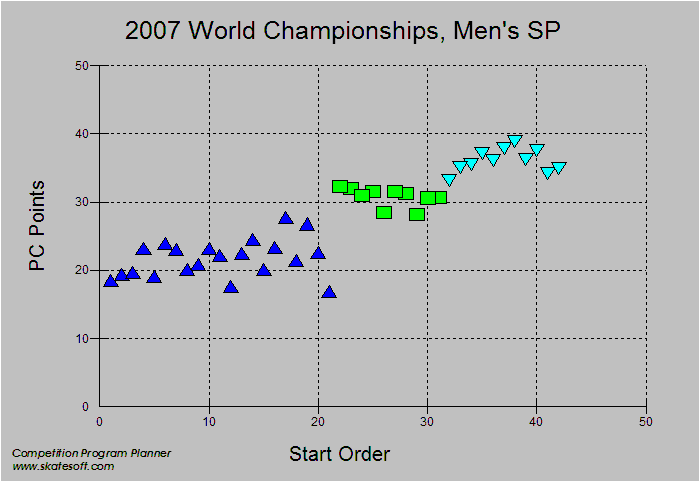
The Men’s Short Program at 2007 Worlds, shown above, the same effects. We have what looks like two different competitions, one in the morning (blue) and the other in the evening (green and cyan). There in an 8 point jump from the end of the morning marks to the start of the evening marks. The morning skaters trend up in PCs (and also GoEs) and there is increasing spread in the scores as the morning skaters perform. Again, this leads one to wonder if increasing fatigue causes more erratic judging.
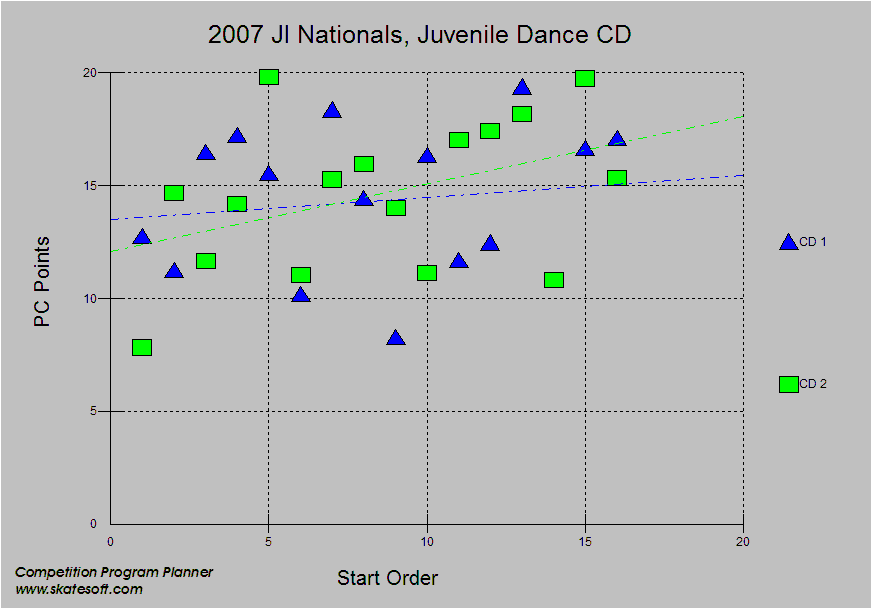
This final example if for the Juvenile Compulsory Dances at the 2007 JI Nationals. The blue plot is for the first dance and the green plot is for the second dance.
If the trend in the blue plot upwards was due to the quality of the skating then we would expect the trend in the green curve to be down when the start order is shifted in the second dance – as is seen under 6.0, as discussed above. Under IJS, however, both dances trend up indicating that the drift in the judges marks is the main reason for the trends seen in the plots. The Compulsory dances for the Intermediate Dance event shows the same effect.
In examining many event segments in both domestic and international competition we thus find that there is a clear systematic trend for program component marks to drift upwards during an event. This effect is present even for groups with as few as 12 skaters. The magnitude of this effect it typically 2-6 points in total Program Component score. In very large events we find a hint that marks become more erratic later in events. In events which are broken into two halves with a long break in between we find that the scoring in the second half shows a marked discontinuity from the scoring in the first half, rendering the event into two separate competitions with different scoring standards. Event segments that drift downward are extremely rare and can be explained by the luck of the draw where a large number of the best skaters perform early in the event, hiding the effect of drift.
In addition to drift in PC scores we have also looked at drift in Base Value score (which potentially could exist due to drifts in judgment by the Technical Panels), and also at drifts in the GoE scores.
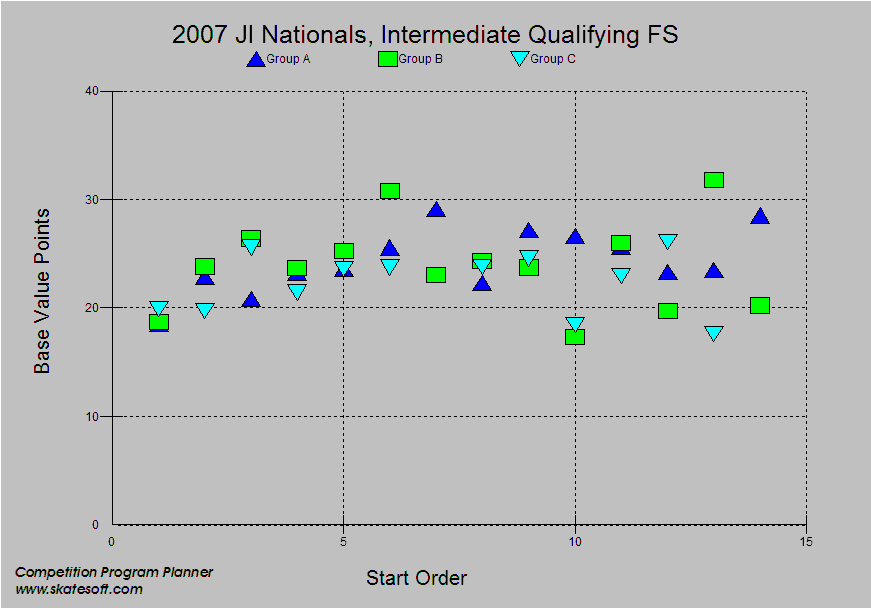
This example is for the three Intermediate Ladies qualifying Groups from 2007 JI Nationals. For Base Value points the trend is essentially horizontal, with only a small turn down for the first skater in each warm-up group. The average Base Values in each qualifying group is nearly the same confirming the skaters in the three groups were of essentially the same skill level (the groups are seeded with that goal). It also indicates the judgments of the Technical Panels were consistent for all three qualifying groups. Analysis of other events supports the view that judgment of the Technical Panels is usually consistent within an event.
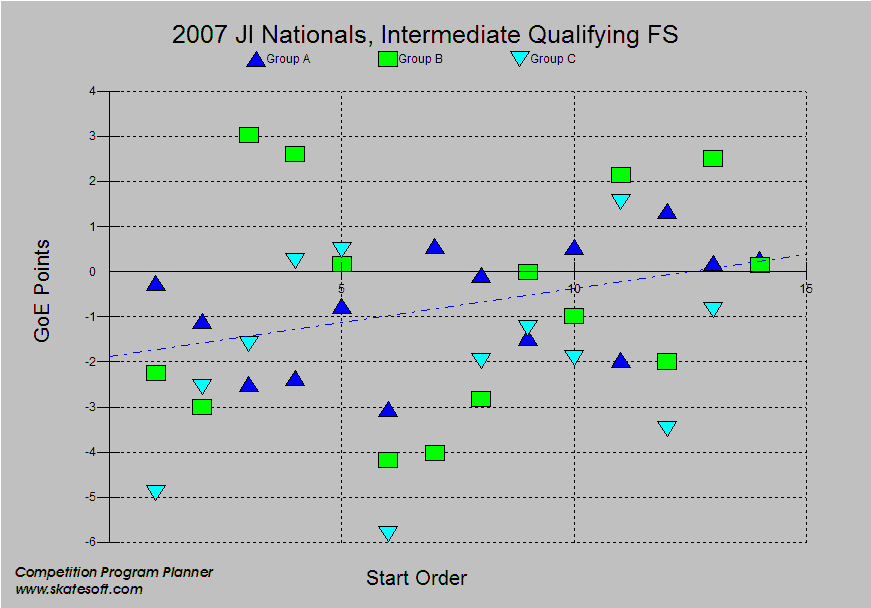
Nevertheless, the trend for GoE points for each skater has a small trend up. It amounts to about 2 points over 14 skaters. This plot indicates the judges tend to be more generous in their GoE marks later in an event. Thus, though the panels marked to generally the same average GoE standard, the standard drifted up by about 2 points over the event.
For all the competitions examined in this study we calculated the drift in PCs, BVs, and GoEs. We consistently find that the GoE scores drift upwards typically by 1-2 points, which is less than for the PC score drift, but still significant. Combined with the drift in PC scores, the combined drift for GoE and PC scores together is usually 3-8 points in an event segment. Drift in BV scores is generally insignificant in IJS scoring.
A scoring drift of 3-8 points in a single event segment (and potentially 6-16 points in an event with two event segments) can have a serious impact on results, where places are typically decided by 1-3 points or less, and medals have been decided by 0.01 points. At the Juvenile level, a 3 point drift is equivalent to giving the skaters in the last warm-up group a gift of two extra double jumps, while 8 points is equivalent to five extra double jumps. At the senior level 8 points is the same as two extra triple toe loops.
To determine the effect of scoring drift on the results, the following analysis was conducted.
For each of the three example Intermediate qualifying groups discussed above, the drift in marks was calculated throughout the event. The drift was then subtracted from the total points, keeping the average score for each qualifying group constant. These revised points were then rounded to two decimal places and a revised order of finish was calculated. The following tables give the results for this calculation.
Start |
Place |
Points |
Revised Points |
Revised Place |
GROUP A |
||||
|
14 |
1 |
67.52 |
60.86 |
2 |
|
7 |
2 |
66.25 |
66.76 |
1 |
|
10 |
3 |
62.19 |
59.63 |
3 |
|
12 |
4 |
56.96 |
52.35 |
11 |
|
13 |
5 |
56.35 |
50.72 |
12 |
|
9 |
6 |
56.09 |
54.55 |
7 |
|
8 |
7 |
54.33 |
53.82 |
9 |
|
4 |
8 |
54.26 |
57.84 |
4 |
|
11 |
9 |
53.41 |
49.83 |
13 |
|
6 |
10 |
52.26 |
53.8 |
10 |
|
5 |
11 |
51.78 |
54.34 |
8 |
|
2 |
12 |
51.16 |
56.79 |
5 |
|
1 |
13 |
49.21 |
55.87 |
6 |
|
3 |
14 |
43.05 |
47.66 |
14 |
GROUP B |
||||
|
13 |
1 |
73.34 |
71.37 |
1 |
|
3 |
2 |
67.48 |
69.09 |
2 |
|
11 |
3 |
66.09 |
64.83 |
4 |
|
4 |
4 |
64.77 |
66.03 |
3 |
|
5 |
5 |
58.88 |
59.78 |
5 |
|
6 |
6 |
58.81 |
59.35 |
6 |
|
9 |
7 |
57.49 |
56.95 |
7 |
|
14 |
8 |
52.13 |
49.8 |
9 |
|
8 |
9 |
51.14 |
50.96 |
8 |
|
7 |
10 |
49.48 |
49.66 |
10 |
|
2 |
11 |
47.51 |
49.48 |
11 |
|
12 |
12 |
46.41 |
44.8 |
12 |
|
10 |
13 |
43.17 |
42.27 |
14 |
|
1 |
14 |
41.34 |
43.67 |
13 |
GROUP C |
||||
|
11 |
1 |
60.69 |
58.95 |
2 |
|
5 |
2 |
59.97 |
60.84 |
1 |
|
9 |
3 |
57.22 |
56.35 |
4 |
|
4 |
4 |
55.08 |
56.38 |
3 |
|
8 |
5 |
54.79 |
54.36 |
6 |
|
12 |
6 |
53.67 |
51.5 |
7 |
|
3 |
7 |
53.13 |
54.87 |
5 |
|
13 |
8 |
48.29 |
45.68 |
10 |
|
2 |
9 |
46.08 |
48.25 |
8 |
|
6 |
10 |
45.64 |
46.07 |
9 |
|
10 |
11 |
44.46 |
43.16 |
12 |
|
1 |
12 |
41.78 |
44.39 |
11 |
There is a significant change in the results for Group A, however, by the luck of the draw, the best skaters were clustered in the last warm-up group. This causes the effect of drift to be overestimated, and thus the place changes overestimated. In Groups B and C the best and worst skaters are evenly distributed with start order.
Due to drift, there were three place switches in Group B; one involving medal winners had this been an event in it’s own right.
In Group C there were more significant place changes, affecting all four medal places had this been an event in it’s own right. In addition, as a qualifying round, drift altered the advancement to the championship round for one pair of skaters. In fact, in this group, every place was changed by the presence of scoring drift!
A similar analysis was done for the Short Programs at the 2007 U.S. Nationals, with similar results obtained. Hopefully this should be obvious. Since the size of the drift is often greater than the typical point difference between sequential places in IJS competition, drift will cause frequent place switches in results.
Upward drift in the scoring standard significantly impacts the skaters’ scores in IJS. It puts skaters in the first warm-up group at a significant disadvantage compare to the last warm-up group. It regularly effects advancement out of qualifying rounds, and the awarding of medals. We suggest it is present in all event segments, in both the GoE scores and the PC scores, though to different extents in each of theses.
For this black cloud, there is one silver lining, that being the Base Value scores from the Technical Panels. The Technical Panels appear to show consistent judgment throughout an event, and even from one event to another for a given day/competition. We attribute this to the following:
The TPs have explicit guidelines for what will be called. Not always clear! But at least explicit. TPs meet beforehand and decide how the current set of gray areas will be handled and then stick with it. During events the TS may "call in the moment" but the panels also discuss whether the gray areas and judgments are being handled consistently throughout an event. Many a time I have heard a TC say or ask for a given skater, in effect, is this the same standard applied for previous skaters. TPs as part of their process (at least the ones I have witnessed) make an effort to insure their judgment is consistent. The reward for this is that Base Value scoring judgment remains generally consistent throughout an event. At the Regional competition I worked this year, the TP standards were passed from one panel to the next, and more or less the same panels were used for all qualifying groups in given division. With this approach, consistency of judgment is enforced from one event to another, at least at a given competition. Where the TP process breaks down is in the constant revisions, clarifications and interpretations that come down from one competition to the next. This makes consistency of judgment from one competition to another impossible.
Now for the GoE scores. The GoE scores given by the judges show a small upwards drift of 1-2 points during an event segment. What is different for the GoEs compared to the Base Values that might cause this?
The Judges also have explicit (maybe even clear!) guidelines for what GoE to give in a given situation. If the skater does this, give this GoE. If the skater does that, give this other GoE. What the judges do not have is a process to insure a consistent standard is applied throughout an event. The mantra of "DON'T FORGET THE FIRST WARM-UP GROUP!" heard in every judge’s school and at every competition has been replaced by "JUDGE IN THE MOMENT!" If a person is asked to judge in the moment, and no process is included to insure consistency of judgment, drift in the judging standard is inevitable.
For the PCs, upward drift in the judging standard is up to four times greater than for the GoEs. For the PCs not only are the judges asked to forget the first warm-up group (judge in the moment) they also do not have explicit guidelines for what marks to give in all situation. The five PC have nearly 40 criteria, none of which have explicit standards for what mark goes with specific examples of what one sees on the ice.
For example, one of the Program Component criteria is Pattern and Ice Coverage. There is no explicit table of examples for what constitutes good or bad ice coverage. There are no pictures or diagram of what is good or bad ice coverage. There is no table of values to say if you see this type of pattern do this to your marks. Now multiply that ambiguity by 40! The judges have precious little firm guidance for what marks to give, and are discouraged from comparing the marks they gave at the beginning of an event to the marks they give at the end.
Without the anchors of explicit guidelines and a self consistent process it is no wonder the PC marks drift significantly.
Taken as whole, where the system provides explicit guidelines and allows comparative judgment, there appears to be little drift (the BVs). Where there are explicit guidelines, without comparative judgment there is modest drift (GoEs). Finally, where there are neither explicit guidelines nor comparative judgment there is significant drift (PCs). Could the pattern be any clearer!
Why this drift is upwards, though, is not at all clear. It has been suggested to us that there are several psychological effects at work which, when uncontrolled by good process, tends to push a person towards higher marks as an event progresses. We suspect that may be true, but from the scores alone it is impossible to determine what, if any, such effects are at work. To get an answer for that would require specifically designed experiments, beyond simply examining the marks.
In view of the impact drift has on competition results, the new seeding method used at ISU competitions seems ill-advised; so also, is breaking events into two groups that compete at vastly different times or on different days. The thought that a point system allows the judging of groups of ever larger size, without limit, is not tenable in the presence of scoring drift; and neither is the idea that advancement from qualifying rounds can be based on points instead of the current placements within the groups.
Given the adverse affect drift has on the scores, changes to the scoring system and in training the judges are clearly warranted. But it is suggested simply bringing back "don’t forget the first warm-up group" would probably go a long way to reducing scoring drift.
Ever more complicated seeding rules, however, are not a likely solution. Seeding only covers over the problem, does not really level the playing field, and makes competition results somewhat self fulfilling.
For example, consider a skater ranked just high enough to get into the later warm-up groups of a Short Program. Being in a later warm-up group gives the skater a bump up in SP points, and a higher place. The higher place gets them a better start order position in the Free Skate. The later start order in the Free Skate gives them a bump up in points again, and a higher place. The better results go into a higher ranking. And finally, the higher ranking gives them an even better seeding in the future, where drift will help them even more.
No, far better and far more fair to fix the system, and better train the judges, to eliminate the problem at the source.
Copyright 2007 by George S. Rossano